Executive summary: College students' time use and labor market plans
This post is an “executive summary” of my masters’ thesis in the style of an NBER Digest write-up.
In College students’ time use and labor market plans, I investigate whether college students’ time use is related to their plans for the job market immediately after graduating, and, if so, what the nature of that relationship might be. I consider three outcomes that could be considered binary indicators of labor market success in the fall after graduation: whether students plan to work full-time in any job, whether students plan to work (part- or full-time) in a job that is a step in a desired career, and whether students applied to at least one graduate school.
I find that the students who plan to go to work immediately after they finish college, as well as the students who plan for jobs that are career steps, are the students who spent large amounts of time on social activities and who spend relatively little time on solitary and academic activities. The students who apply to graduate school spend the most time on solitary and academic activities and the least amount time on social activities. However, a student’s time use distribution could also be associated with their choice of major, and major choice is a well-known determinant of job market outcomes. Therefore I stop short of concluding that students’ make different career plans because of their time use choices.
I also obtain several secondary results. One is that students do not seem to make direct trade-offs between social and academic activities. Another is that students who spend time on general socializing also tend to spend time on other social activities, such as extracurricular activities, partying, and attending sports events. I also find that, junior-year time use is more important for predicting labor outcomes than sophomore- and freshman-year time use. More work is needed to understand why this might be the case; one possibility is that older students’ labor market goals are clearer and so in later years they are better able to align their time with those goals.
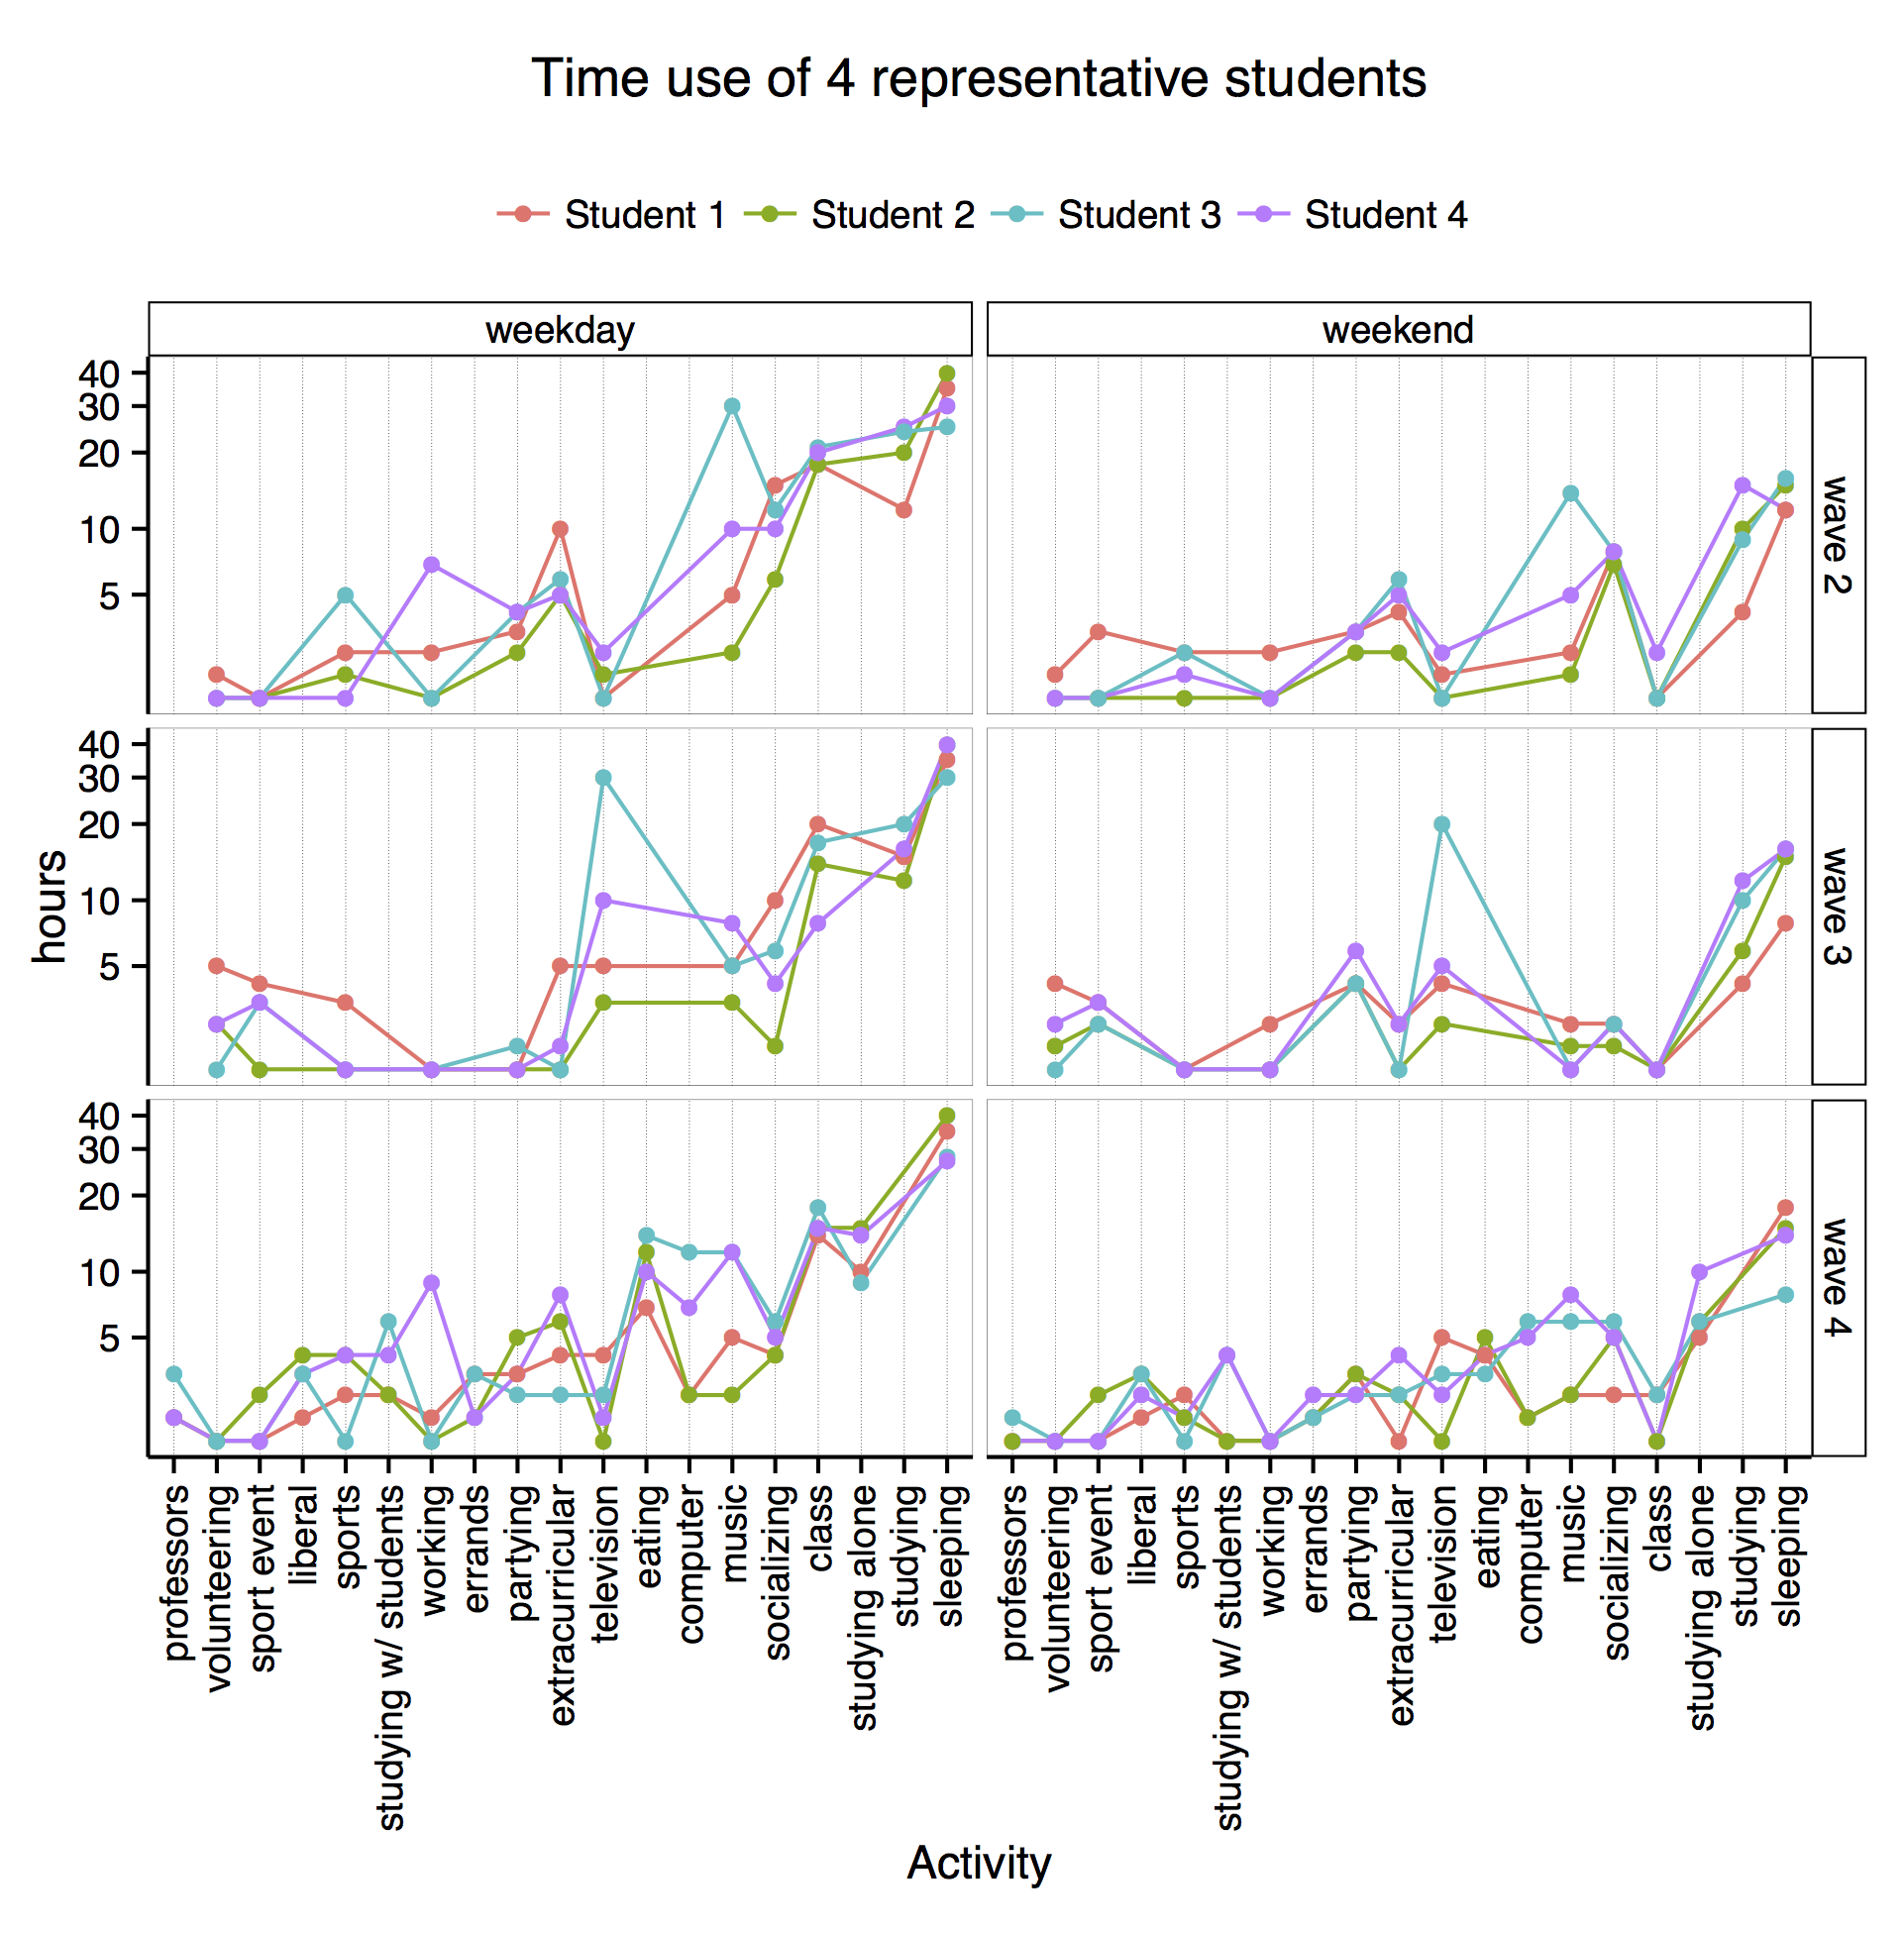
Plot notes: “Weekday” time use refers to the total hours spent on each activity in the last full week (Monday-Friday) of classes before the survey was administered. “Weekend” time use refers to the last full weekend (Saturday-Sunday) between full weeks of classes. Wave 2 is the spring of freshman year, wave 3 is the spring of sophomore year, and wave 4 is the spring of junior year. Not all activities are measured in all years, and measured activities are indicated with a dot. The lines connect measurements for a single student; they are purely a visual aid, and do not represent a time series. Activities are ordered on the x-axis by average overall time use. Data source: National Longitudinal Survey of Freshmen.